POZNAN FUA
Objectives
• decrease of congestions and air pollution
• holistic analysis of the condition and quality of freight transport distribution
• definition of critical flow disturbance points for freight transport
The territorial context:
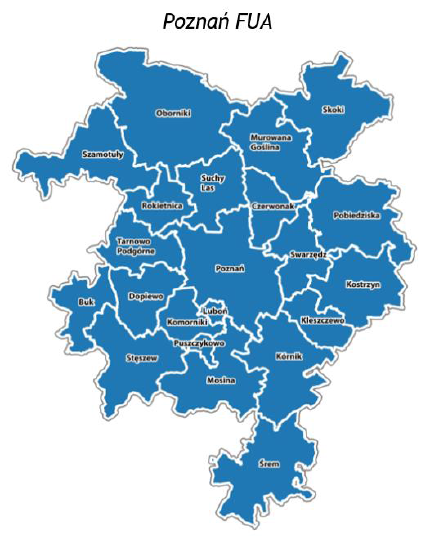
• Poznań FUA involved 22 municipalities
• 3 082 km2 – Poznań FUA area
• 1 022 844 – Poznań FUA number of inhabitants
• 177 865 - Poznań FUA number of the employers
• Surveyed area - City of Poznan
• 259 km2 – City of Poznan area
• 532 346 – City of Poznan population
• 25 328 - number of the employers
• 5 city zones used in the tool and in the o/d matrix
The area of the survey is the most logistically inconvenient area within the Poznan FUA due to a major problem with supplies within the city’s area
In the selection of the division criteria, a significant factor was the comparability of sizes and of amounts of population of the particular districts so that
they could be compared easily. The adopted variant is the most optimal of the possible divisions despite differences in sizes and populations of the zone
Results generated by the tool application
Survey sample – 302 companies
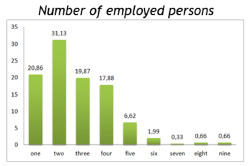
Number of employed persons
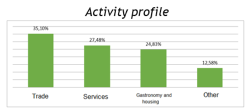
Activity profile

parking places for vehicles at time of delivery
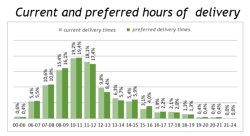
Current and preferred hours of delivery
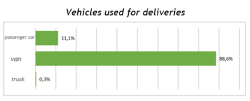
Vehicles used for deliveries
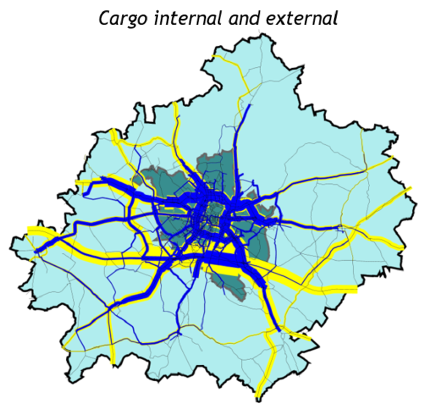
Cargo internal and external
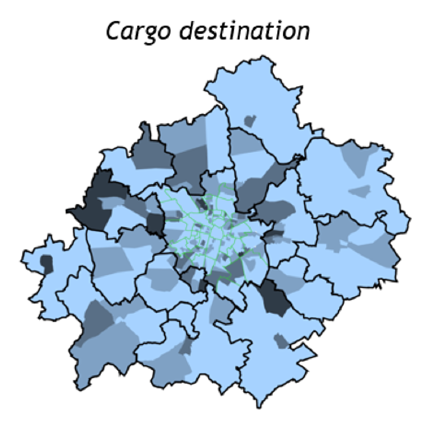
Cargo destination
Freight Quality Partnership
• Public steakholders: Poznan City Hall, Municipal Road Authority, Urban Transport
Administration
• Private steakholders: Agamat, Marol (Chata Polska), Eurocash, Papukurier,
PointPack.pl, Transmeble, Jeronimo Martins, Rentis, Volkswagen Poznań, Dachser, DHL
Parcel, VEMAT, Pol-Bus, GLS
Objectives
• Support for Poznan City Hall in formulation of SULP
• Establishing platform for cooperation between FQP participants
• New pilot projects in urban freight transport
• Unloading bays
• Interactive roadmaps for drivers
• Regulations for deliveries (SULP)
• Contribution to policy / strategy development
Private stakeholder engagement results
• 2 meetings of the FQP group
• Brainstorming session
• First selection of the most interesting topics for FQP participants
• Involvement of the very active private stakeholders like Volkswagen Poznań
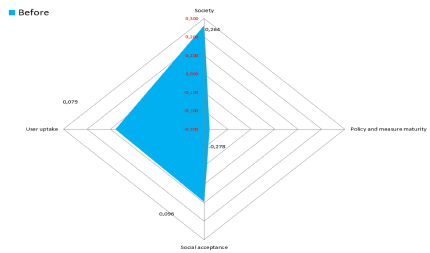
Logistics Sustainability Index (LSI)
Impact Areas:
- society
- policy
- social acceptance
- user uptake
Data interpretation
• The vast majority of the surveyed entities have a small number of employees, which may be
due to the specific nature of the analysed industries and result of the Poznan enterprises
structure. There is no difference in terms of employment compared to other surveyed
companies from gastronomy and hotel sectors
• Most companies have 1 main supplier. Every 3 indicates 2 suppliers, and only 13% of the
surveyed entities have 3 suppliers. In a sense, this situation illustrates the level of
dependence of major suppliers of goods
• Most deliveries are made at least a few times a month, with one third of the companies using
more frequent deliveries, which may be due to very limited warehouse space
• Delivered goods are usually imported in boxes and cartons. The declarations of the surveyed
companies show that the delivery is generally short (up to 10-20 minutes) and the delivered
goods do not exceed several tens of kilograms
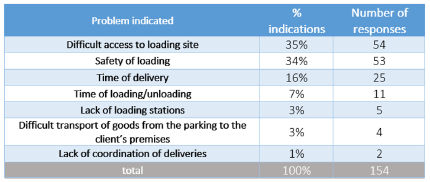
• Among the most frequently reported supply problems, respondents indicate difficulties in
accessing loading and unloading sites. The sense of security of the goods suffers from that
and delivery times are prolonged.
To read more information about Poznan FUA click here
