Work Package 2
Green Infrastructure Functionality Assessment: Field Mapping Methodology
The key tool for the assessment of green infrastructure at the local level was the on-site inspection of selected test sections within the case study areas. The selection was derived from the results of the map of green infrastructure based on CORINE Land Cover (2012) as well as the Morphological Spatial Pattern Analysis (MSPA) and the measurement of the Euclidean Distance in order to locate GI that is important for the connectivity on the landscape scale. The aim of the local GI mapping was to deliver a detailed view of the selected sites that shows the high diversity actually hiding behind the more general classes of CORINE or even the regional datasets. The data was then further processed using GIS software (ArcGIS, QGIS) and Microsoft Excel.
Subsequent to the field work a geodatabase was built up by joining the spatial information of the GI elements with the according obtained field work data. Thus, various maps can be created which depict high-resolution images of the present situation.
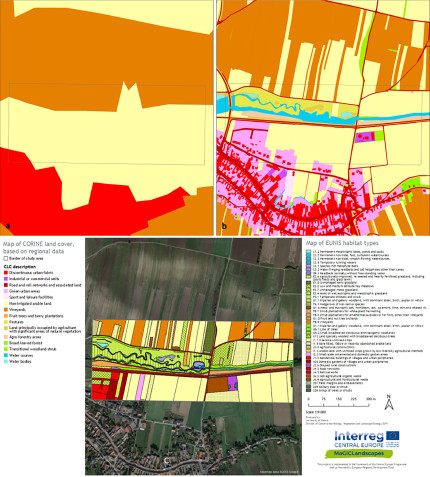
The GI assessment in the Austrian case study area Eastern Waldviertel and Western Weinviertel was focused on wetland habitats and waters. The mapping was conducted in a quadrant of 0.4 square kilometres (400 x 1000 m).

Fig. 9: Map of green infrastructure based on CORINE Land Cover (2012) at transnational (a) and regional (b) resolution compared to GI based on the EUNIS Habitat classification (2017) on the local scale with the focus on wetland habitats and waters
Maps of the state of naturalness based on the hemeroby index
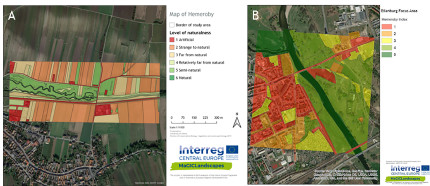
Another output is an equally detailed view of anthropogenic influence on several GI elements. These maps of the state of naturalness serve as basis to determine local high priority areas where the need for action to improve or maintain GI is given. The hemeroby index measures the hemerobiotic state of an area: the magnitude of the deviation from the potential natural vegetation caused by human activities.
While the classification of the EUNIS categories tells the mapper what GI elements are in the study area, the evaluation of the naturalness gives clear information about the ecological quality of those elements. This is very useful to distinguish within the elements categorised as "GI" or "partly GI" and of course "not GI" in terms of their condition. This allows the determination of the high-value areas on the local scale and, subsequently, appropriate recommendations for management can be provided.

Fig. 10: Results of the local GI assessment, showing the level of hemeroby for the case study areas Eastern Waldviertel & Western Weinviertel (A) and Dübener Heide Nature Park (B)
Barriers
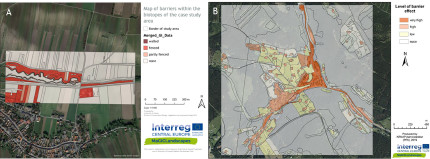
Taking into account barriers (walls, fences or other structures) within single GI elements increases the view on the connectivity of GI. Barriers reduce the permeability of GI to fauna and flora (and people). Lack of movement possibilities affects the gene flow of the population and may lead to local extinction. Anthropogenic structures like buildings or fenced gardens mostly have a barrier effect within the landscape. However, the hemeroby does not always indicate the presence of barriers in the element.
This allows the detection of areas with limited permeability in order to develop specific management strategies on regional and local level to manage existing or implement potential GI and to remove obstructions and barriers where possible in order to create the possibility of ecological corridors for species migrations and genetic exchange.

Fig. 11: Results of the local GI assessment showing the barriers for the case study areas Eastern Waldviertel & Western Weinviertel and (A) and Krkonoše National Park (B)
Back to WP2 OVERVIEW
Read on with WP2: FUNCTIONALITY ANALYSIS
Back to MAIN PAGE
